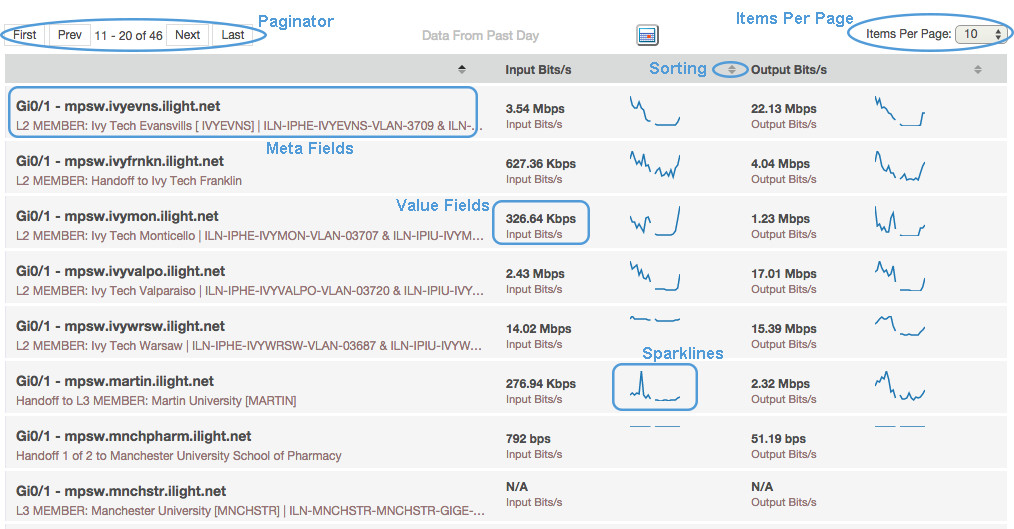
The results for the selected measurement type are displayed as rows in the Data Explorer. Each row consists of a subset of the measurement type’s metadata, some summary statistics on a subset of its values, and spark line charts that show the trend of the data.

- Meta Fields
-
The first column consists of the measurement’s meta fields. In each row, the first line shows the first two ordinal meta fields and the second line shows the third and forth ordinal meta fields. The ordinal significance of a measurement’s meta field is defined on a per measurement type and per classifier basis.
- Value Fields
-
The subsequent columns display the required value fields of the measurement. Each entry consists of the value's name and average within the selected timeframe of the Data Explorer.
- Sparklines
-
Show the overall trend of the value field's data overtime.
- Paginator
-
Enables users to navigate through pages in the Data Explorer. The text in the middle indicates the current page.
- Items Per Page
-
Enables users to change the items per page displayed in the Data Explorer.
- Sorting
-
Enables users to sort the entries in the Data Explorer by each column.